Spike Timing Reliability
Reliability of spike timing.
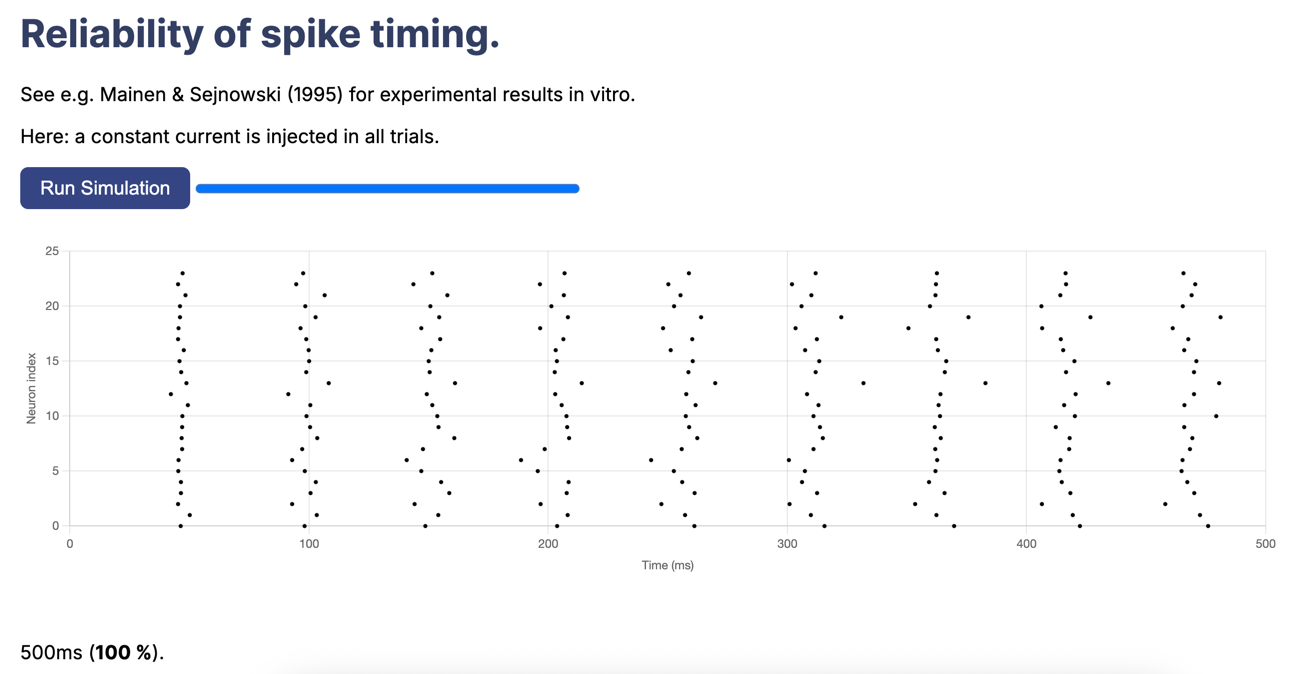
See e.g. Mainen & Sejnowski (1995) for experimental results in vitro.
Here: a constant current is injected in all trials.
// non_reliability.py
from brian2 import *

N = 24
tau = 20*ms
sigma = .015
eqs_neurons = '''
dx/dt = (1.1 - x) / tau + sigma * (2 / tau)**.5 * xi : 1 (unless refractory)
'''
neurons = NeuronGroup(N, model=eqs_neurons, threshold='x > 1', reset='x = 0',
                      refractory=5*ms, method='euler')


spikes = SpikeMonitor(neurons)
run(500*ms,  report='text', report_period=0.1*second)
<!-- non_reliability.html --> <!DOCTYPE html> <html lang="en-us"> <head> <meta charset="utf-8" /> <meta http-equiv="Content-Type" content="text/html; charset=utf-8" /> <title>Reliability of spike timing</title> <script src="brian.js"></script> <script> function myplot(event) { console.log("before results fetch"); const brian_results = event.data.results; console.log(brian_results); // Extract the spike data const spikes_t = brian_results["spikemonitor"].t; const spikes_i = brian_results["spikemonitor"].i; // Create scatter plot data points let scatterData = []; if (spikes_t && spikes_i && spikes_t.length === spikes_i.length) { for (let idx = 0; idx < spikes_t.length; idx++) { scatterData.push({ x: spikes_t[idx] * 1000, // Convert to milliseconds y: spikes_i[idx], }); } } else { console.error("Spike data format is not as expected"); } const ctx = document.getElementById("brian_canvas"); // Clear any existing chart Chart.getChart(ctx)?.destroy(); new Chart(ctx, { type: "scatter", data: { datasets: [ { data: scatterData, backgroundColor: "black", pointRadius: 2, pointHoverRadius: 4, showLine: false, }, ], }, options: { responsive: true, maintainAspectRatio: false, plugins: { legend: { display: false }, tooltip: { enabled: true, callbacks: { label: function (context) { return `Neuron: ${ context.raw.y }, Time: ${context.raw.x.toFixed(2)} ms`; }, }, backgroundColor: "rgba(0, 0, 0, 0.7)", titleFont: { size: 14, }, bodyFont: { size: 14, }, padding: 10, }, }, scales: { x: { type: "linear", position: "bottom", title: { display: true, text: "Time (ms)", }, ticks: { stepSize: 100, }, }, y: { type: "linear", title: { display: true, text: "Neuron index", }, }, }, elements: { point: { radius: 2, backgroundColor: "black", hoverBackgroundColor: "#d17930", hoverBorderColor: "black", hoverBorderWidth: 1, }, }, interaction: { mode: "nearest", intersect: true, axis: "xy", }, animation: false, }, }); } var brian_sim = new BrianSimulation( (result_plots = [{ type: "custom", func: myplot }]) ); // wait until the website is fully defined window.onload = (event) => { brian_sim.init(); }; </script> <link rel="stylesheet" href="https://fonts.googleapis.com/css2?family=Inter:wght@300;400;600&display=swap" /> <script src="https://cdn.jsdelivr.net/npm/chart.js"></script> <style> body { font-family: "Inter", sans-serif; font-size: 1.2rem; padding: 20px; } h1 { color: #333e63; } .btn--runSimulation { background-color: #344683; color: white; font-size: 1.2rem; padding: 10px 20px; border: none; border-radius: 8px; cursor: pointer; transition: background-color 0.3s ease, transform 0.2s ease; } .btn--runSimulation:hover { background-color: #283252; transform: scale(1.05); } .btn--runSimulation:active { background-color: #313e68; transform: scale(0.98); } .slider-container { max-width: 40%; margin: 15px 0; } .slider-label { display: flex; justify-content: space-between; font-size: 1rem; margin-bottom: 5px; } input[type="range"] { width: 100%; cursor: pointer; } #brian_canvas { margin: 32px 0; } </style> </head> <body> <h1>Reliability of spike timing.</h1> <p>See e.g. Mainen & Sejnowski (1995) for experimental results in vitro.</p> <p>Here: a constant current is injected in all trials.</p> <button onclick="brian_sim.run(); return false;" class="btn--runSimulation"> Run Simulation </button> <progress id="brian_progress_bar" max="1.0" value="0.0" style="width: 20em" ></progress> <div style="width: 90%; height: 400px"> <canvas id="brian_canvas"></canvas> </div> <div id="brian_progress_text"></div> </body> </html>python - m brian2wasm non_reliability.py
Output