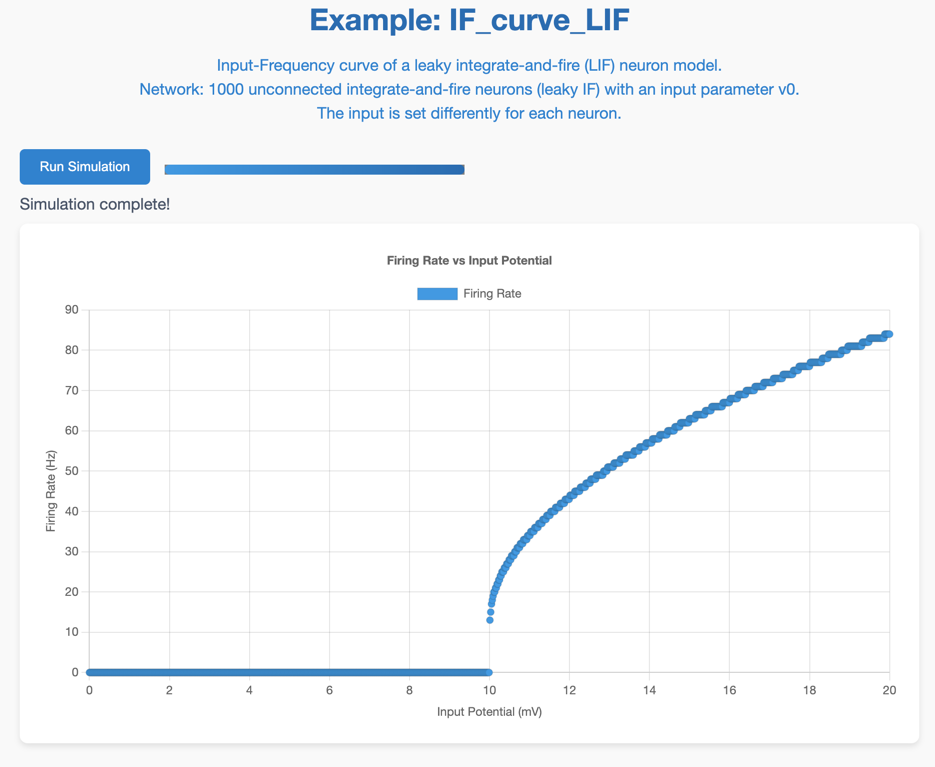
Input-Frequency curve of a IF model
Network: 1000 unconnected integrate-and-fire neurons (leaky IF) with an input parameter v0. The input is set differently for each neuron.
// IF_curve_LIF.py
from brian2 import *

n = 1000
duration = 1*second
tau = 10*ms
eqs = '''
dv/dt = (v0 - v) / tau : volt (unless refractory)
v0 : volt
'''
group = NeuronGroup(n, eqs, threshold='v > 10*mV', reset='v = 0*mV',
                    refractory=5*ms, method='exact')
group.v = 0*mV
group.v0 = '20*mV * i / (n-1)'

monitor = SpikeMonitor(group)

run(duration, report='text', report_period=0.1*second)
<!-- IF_curve_LIF.html --> <!doctype html> <html lang="en-us"> <head> <meta charset="utf-8"> <meta http-equiv="Content-Type" content="text/html; charset=utf-8"> <meta name="viewport" content="width=device-width, initial-scale=1.0"> <title>Example: IF_curve_LIF</title> <script src="brian.js"></script> <script src="https://cdnjs.cloudflare.com/ajax/libs/Chart.js/3.9.1/chart.min.js"></script> <style> body { font-family: 'Helvetica Neue', Arial, sans-serif; max-width: 900px; margin: 0 auto; padding: 20px; background-color: #f9f9f9; } .chart-container { height: 480px; background-color: white; padding: 20px; border-radius: 8px; box-shadow: 0 3px 6px rgba(0, 0, 0, 0.1); margin-bottom: 25px; } #brian_progress_bar { width: 300px; height: 10px; border-radius: 5px; background: #e2e8f0; margin-left: 10px; max-width: calc(100% - 10px); } #brian_progress_bar::-webkit-progress-value { background: linear-gradient(to right, #4299e1, #2b6cb0); border-radius: 5px; } .run-button { background-color: #3182ce; color: white; border: none; padding: 10px 20px; border-radius: 5px; cursor: pointer; } .run-button:disabled { background-color: #aaa; cursor: not-allowed; } #brian_progress_text { margin-top: 10px; color: #4a5568; margin-bottom: 10px; } .title{ color: #2b6cb0; text-align: center; margin-bottom: 16px; font-size: 30px; font-weight: 600; } .description{ text-align: center; margin-bottom: 24px; color: #3182ce; font-size: 16px; line-height: 1.5; } @media (max-width: 600px) { body { padding: 10px; } .title { font-size: 24px; } .description { font-size: 14px; } .chart-container { height: 300px; padding: 10px; } #brian_progress_bar { width: 100%; margin-left: 0; margin-top: 10px; } .run-button { width: 100%; } } </style> </head> <body> <h1 class="title"> Example: IF_curve_LIF </h1> <p class="description"> Input-Frequency curve of a leaky integrate-and-fire (LIF) neuron model. <br> Network: 1000 unconnected integrate-and-fire neurons (leaky IF) with an input parameter v0.<br> The input is set differently for each neuron. </p> <button class="run-button" id="brian_run_button" onclick="brian_sim.run(); return false;">Run Simulation</button> <progress id="brian_progress_bar" max="1.0" value="0.0"></progress> <div id="brian_progress_text"></div> <div class="chart-container"> <canvas id="brian_canvas"></canvas> </div> <script> let chart; var brian_sim = new BrianSimulation(result_plots=[{type: 'custom', func: myplot}]); function myplot(event) { const results = event.data.results; const spikes = results.spikemonitor; const n = 1000; const duration = 1.0; // Calculate firing rates let firing_rates = new Array(n).fill(0); for (let i = 0; i < spikes.i.length; i++) { firing_rates[spikes.i[i]]++; } // Prepare the chart data const data = firing_rates.map((count, index) => ({ x: 20 * index / (n-1), y: count / duration })); // Update chart const ctx = document.getElementById('brian_canvas'); if (chart) chart.destroy(); chart = new Chart(ctx, { type: 'scatter', data: { datasets: [{ label: 'Firing Rate', data: data, backgroundColor: '#4299e1', pointRadius: 3.5, }] }, options: { responsive: true, maintainAspectRatio: false, animation: { onComplete: () => { // Finalize progress when chart renders document.getElementById('brian_progress_bar').value = 1; document.getElementById('brian_progress_text').textContent = 'Simulation complete!'; document.getElementById('brian_run_button').disabled = false; } }, plugins: { title: { display: true, text: 'Firing Rate vs Input Potential' } }, scales: { x: { title: { display: true, text: 'Input Potential (mV)' } }, y: { title: { display: true, text: 'Firing Rate (Hz)' } } } } }); } window.onload = function() { brian_sim.init(); }; </script> </body> </html>python - m brian2wasm IF_curve_LIF.py
Output